Invest
Smarter
Near
Top Colleges
Data. Opportunities.
Stronger Communities.
Continue your Augustana investment plan
Comparable market inputs are not available for this screen. Review the published properties and confirm the property-specific numbers with the local professional.
Explore published properties →Choose a college →Explore Top Investment Markets
View all markets →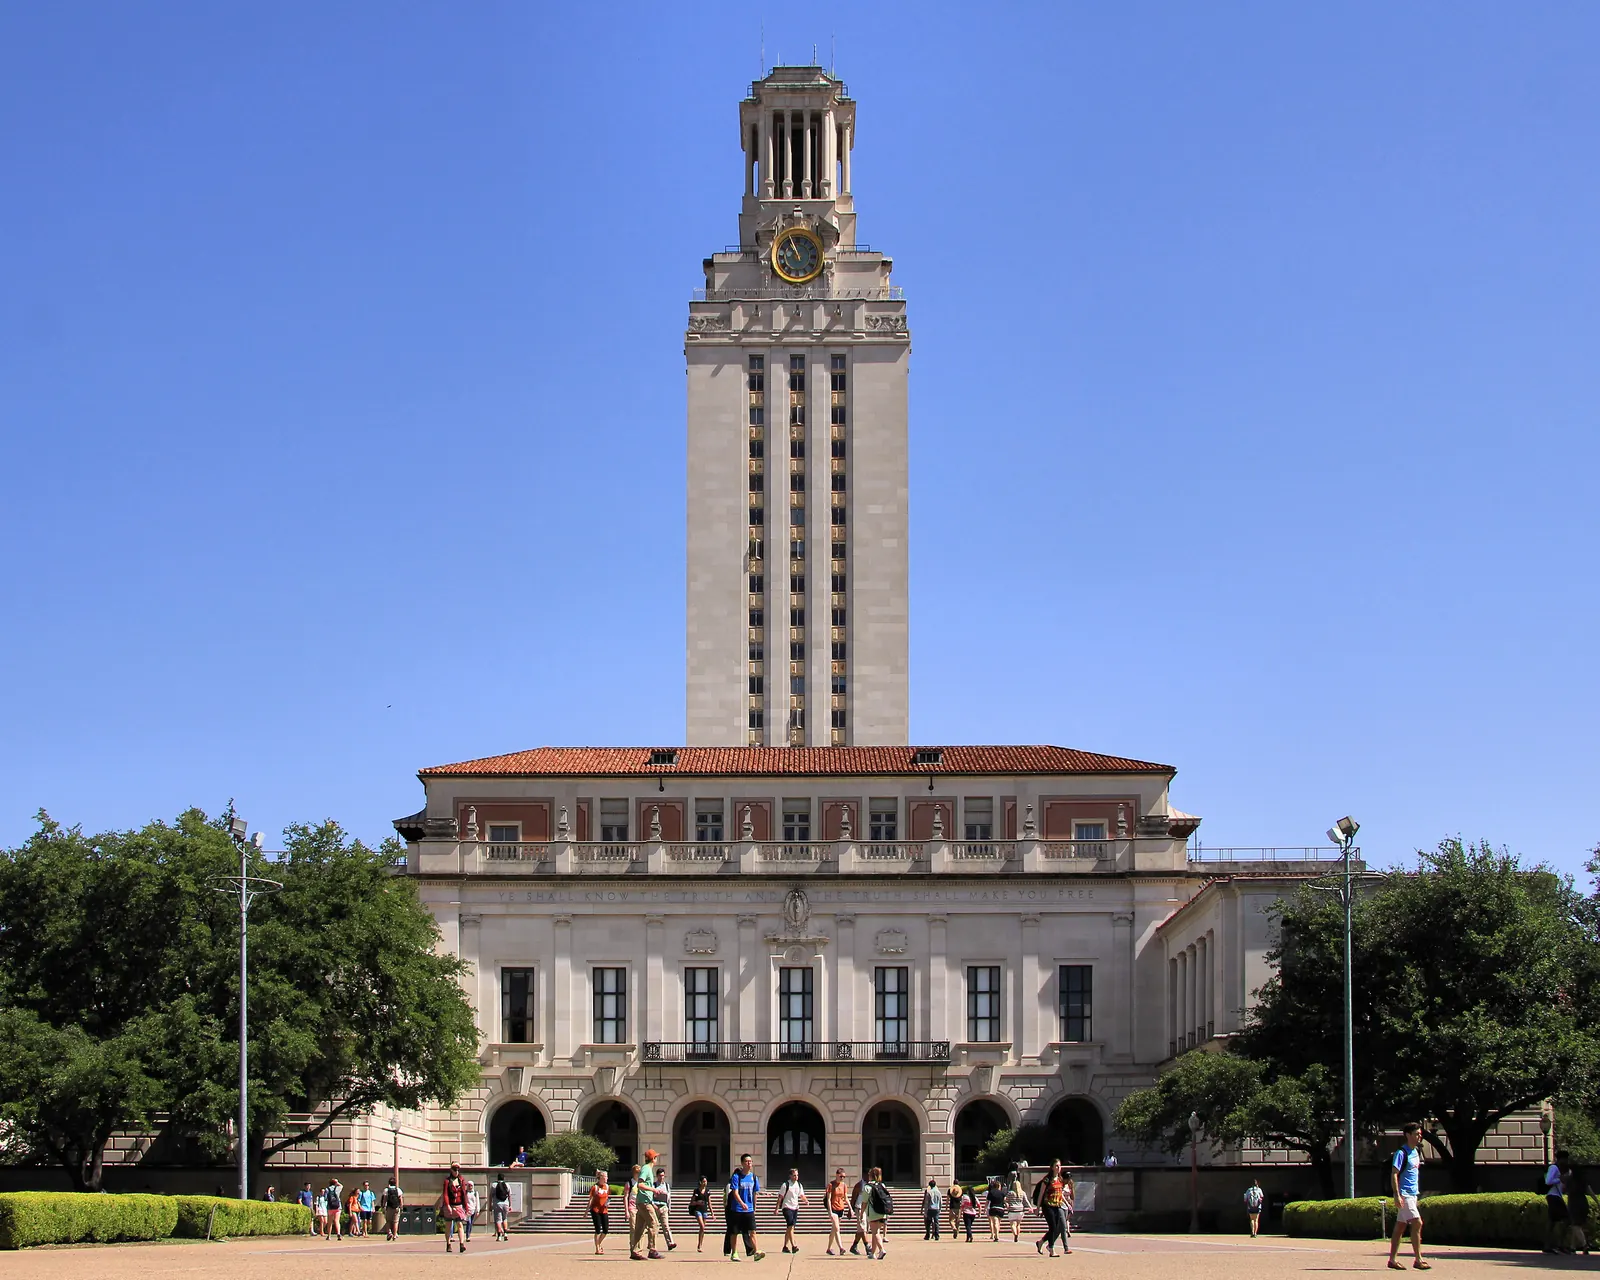
Austin, TX
University of Texas at Austin
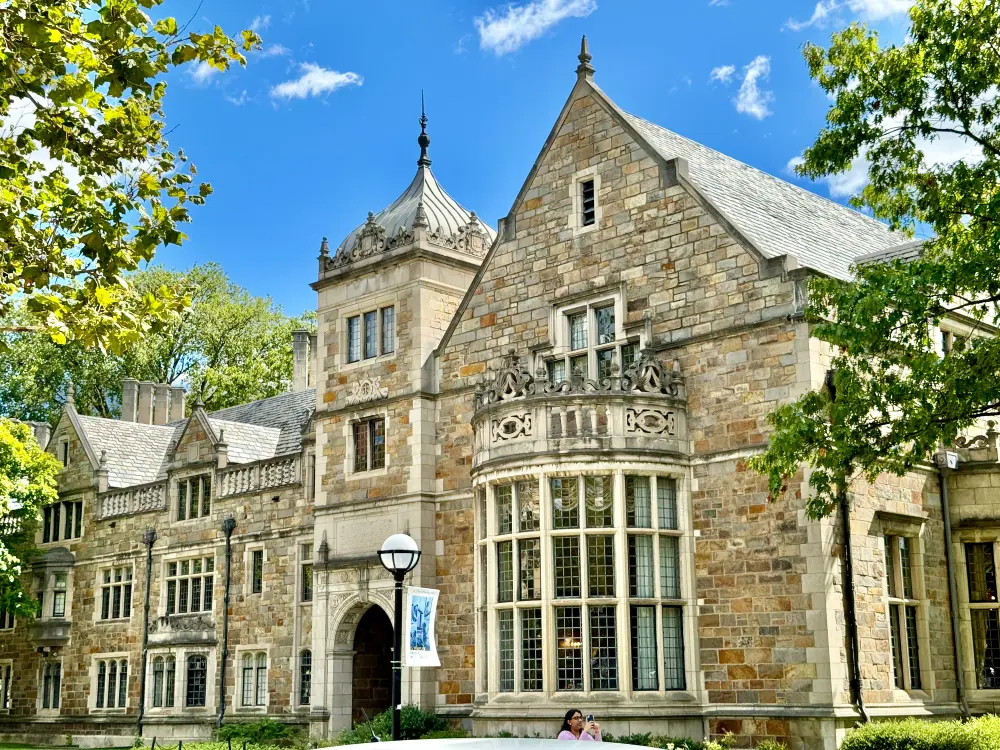
Ann Arbor, MI
University of Michigan
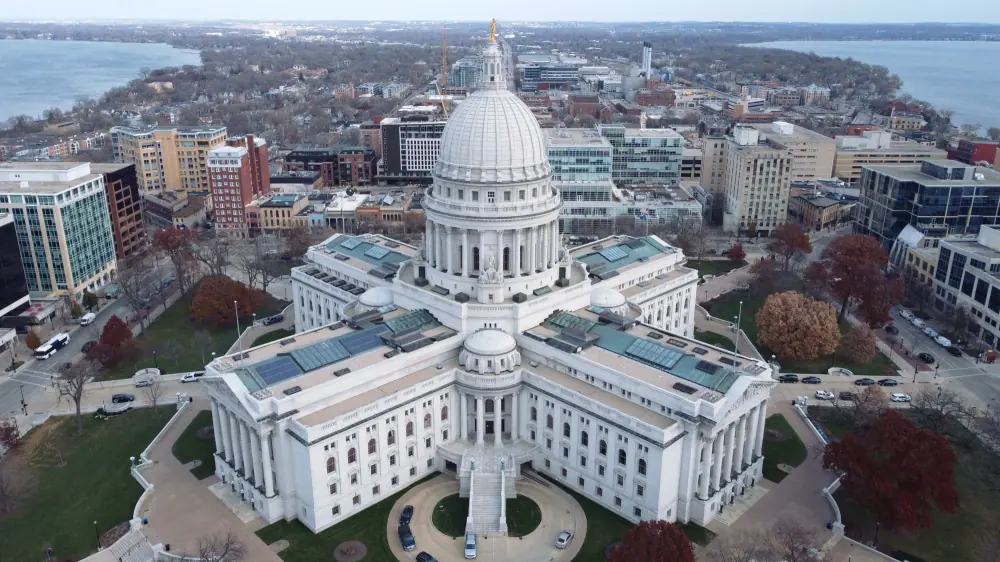
Madison, WI
University of Wisconsin-Madison
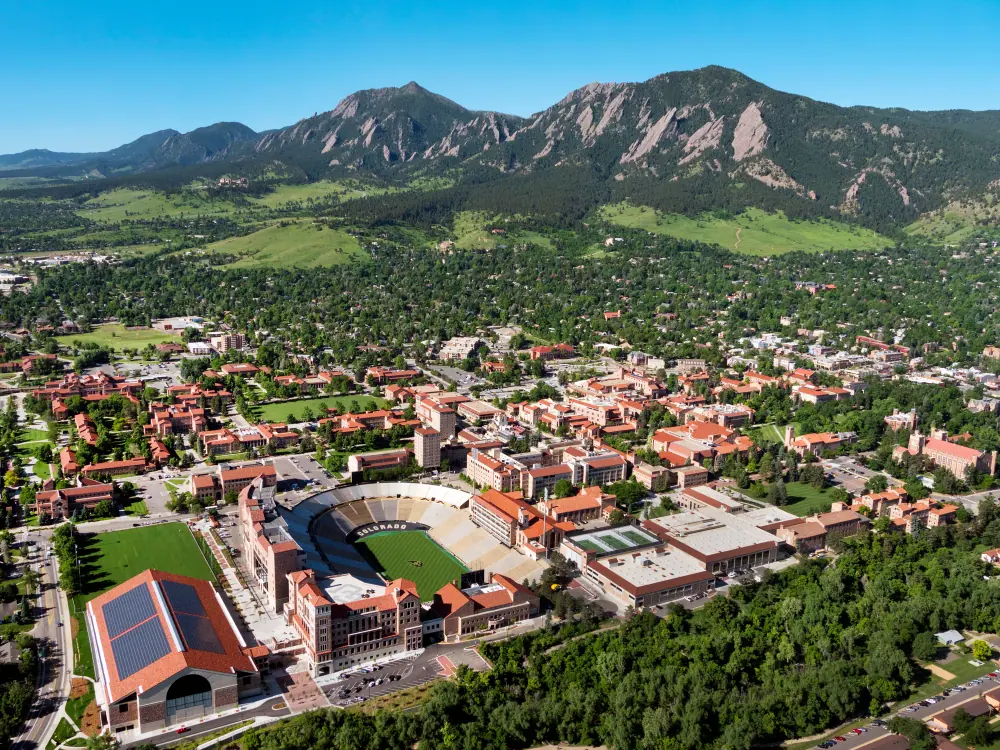
Boulder, CO
University of Colorado Boulder
Market screens are research starting points, not promised returns or investment recommendations. Property-level rent, costs, restrictions and financing require verification.
Gross rent-to-price screen = annualized whole-home three-bedroom asking rent ÷ median sale price. It excludes vacancy, operating costs and debt service, so it is not a cap rate or promised return. Every market observation is dated and linked to its source.
Review full methodology →Market evidence and observation dates
- University of Texas at Austin: rent observation 2026-09 · Rent source; sale observation 2026-07 · Sale source. Evidence checked 2026-09-07.
- University of Michigan: rent observation 2026-09 · Rent source; sale observation 2026-07 · Sale source. Evidence checked 2026-09-07.
- University of Wisconsin-Madison: rent observation 2026-09 · Rent source; sale observation 2026-07 · Sale source. Evidence checked 2026-09-07.
- University of Colorado Boulder: rent observation 2026-09 · Rent source; sale observation 2026-07 · Sale source. Evidence checked 2026-09-07.
Photography credits
- The University of Michigan Law Quadrangle in Ann Arbor — w_lemay, CC BY-SA 2.0.
- Wisconsin State Capitol and the lakes of Madison — Lectrician2, CC BY-SA 4.0.
- University of Colorado Boulder campus beneath the Flatirons — Glenn Asakawa / University of Colorado, CC0.
- Gasson Hall at Boston College framed by autumn trees — BCLicious, CC0.
- The Main Building and Tower at the University of Texas at Austin — Larry D. Moore, CC BY 4.0.
Resized and converted to WebP. Responsive presentation crops the photographs and applies contrast overlays. Adapted photographs retain their source license.
The national overview hero is custom generated editorial artwork, not property photography or market evidence.